PLANH5R01: The number of defectives produced by a group of employees and the number of hours that each employee:
QUESTION 3
The number of defectives produced by a group of employees and the number of hours that each employee was trained are recorded in the table below.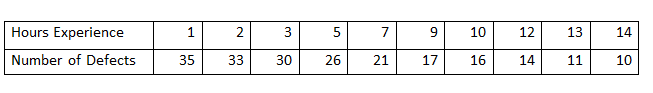
- Is this a causal or a time series model? Explain your answer.
- Using linear regression analysis, estimate the number of defectives that you would expect from two employees that have 4 hours and 11 hours training respectively.
- The correlation coefficient for this set of data is – 0.99, what does this tell us about the relationship between the hours experience and the number of defects? What does it tell us about your forecast in (b)? What other factor(s) must you take into account when considering the forecast accuracy?

